
Loading…
Loading…
Also serving Thodupuzha and Munnar
An Idukki owner asks three things daily: what the crop yielded, what the market paid, how full the rooms were. A dashboard answers before the first phone call.
Official ERPNext Partner · 100+ ERP projects · Since 2011
Or call +91 62358 66111
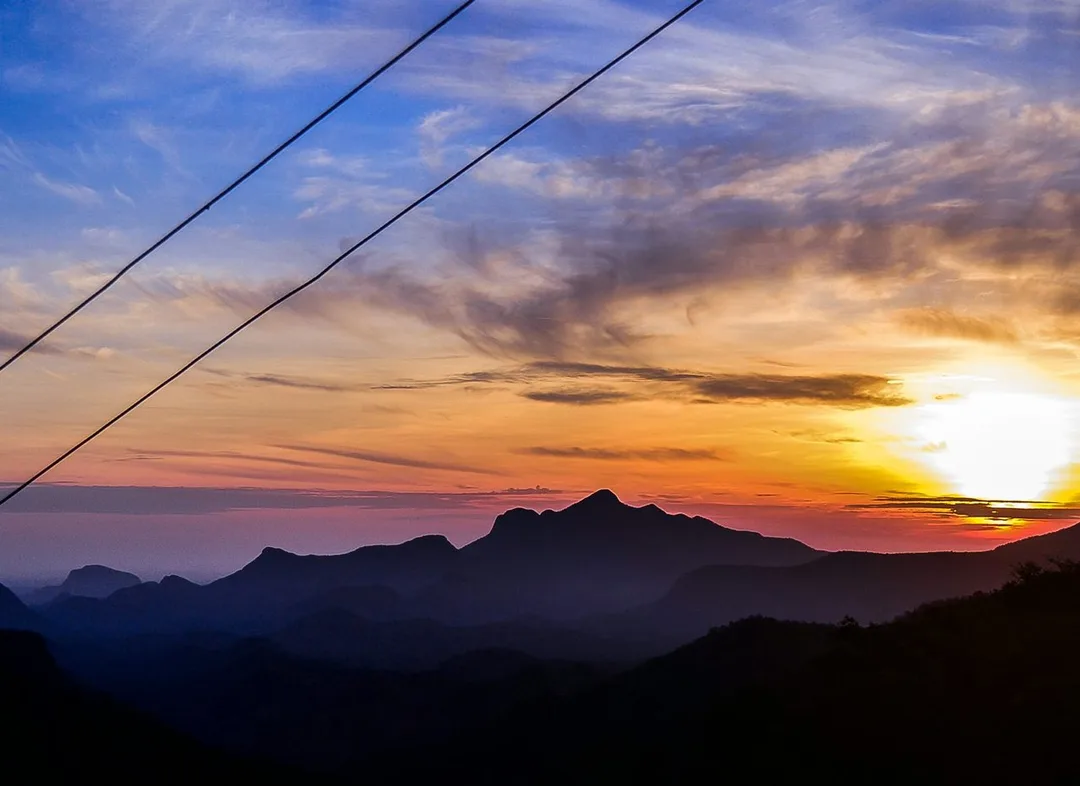
Photo: Rinoj Hashim · CC BY-SA 4.0, cropped · via Wikimedia Commons
Trusted by 200+ organisations across India & overseas — including






























An example
The owner of a cardamom estate and two homestays wakes in Kattappana on a Thursday and opens one screen over breakfast. The first tile shows yesterday's pick by division against the same day last year, with one division shaded because its plucking average has slipped for three days running. The second shows the stock in his godown by grade, valued at the last Vandanmedu auction average, and the age of each lot. The third shows both homestays: rooms sold, rate achieved and bookings on the calendar for the coming weekend. He sends one message to the field officer about the slow division, decides to hold his stock another week, and gets in the jeep. Nobody has had to prepare a report.
Owners in Idukki run on reports that arrive late. The estate manager sends a monthly statement. The accountant produces a profit figure after the quarter. The resort emails an occupancy sheet on Monday. By the time a poor number is seen, the cause is weeks old. Businesses here are also unusually exposed to things outside their control, such as rain, the Vandanmedu auction price and holiday calendars, so spotting a trend early is worth a great deal.
Business intelligence and dashboards from Acube pull data from ERPNext, and from other sources such as property management systems, weighbridge logs or Excel, into clear visual reports: daily KPIs, trends, comparisons by division, product or property, and alerts when a figure crosses a limit. They open on a phone, which suits an owner who is seldom at a desk.

Case studies

Della Fashions
Della Fashions — ERPNext POS Made Checkout 60% Faster Across Every Outlet

DSV Global Transport and Logistics
DSV — ERPNext Asset Tagging Cut Untraceable Assets 21%

Muthoot Securities Limited
Muthoot Securities — MScan, the Flutter App That Cut Document Search Time by 70%
Crop per hectare, plucking average and cost per kilo are calculated after the month closes. A daily dashboard built from muster and weighment entries shows each division against its own target and against last year while there is still time to move labour or adjust rounds.
A trader's real position depends on what the stock is worth today, not what was paid. A dashboard that combines quantity by grade with the current market rate shows unrealised gain or loss, and how long each lot has been held.
A full house at a heavy discount can earn less than a half-full one. Revenue per available room, source of booking, average stay and food revenue per guest, viewed together by property and month, show what is really driving income.
We begin with a short list of numbers you wish you had every morning, not with software. For each we trace where the data comes from and whether it is reliable. Dashboards are built and refined remotely from Kochi, reviewed with you on video calls. Where the underlying data is weak, we say so and fix the source first, because a handsome chart drawn from bad entries does more harm than none.
Discovery. The decisions you make, the figures behind them and where those figures live.
Blueprint and fixed scope. A clear plan, the deliverables and the timeline, agreed in writing before configuration starts.
Configuration. Dashboards and reports built from your ERP and other sources, with the right access.
Data migration. Your data sources connected and the figures checked against your own reports.
Training, go-live and support. Your team tests on real data, we stand beside you at launch, then support continues under a plan.
The scope and timeline are agreed in writing before work starts.
Tea and cardamom plantations
Division-wise crop, labour productivity, input use and cost per kilo, laid over rainfall, with year-on-year comparison for the owner and a simpler daily view for each field officer.
Hydroelectric power
For contractors and service firms around the power stations: work-order progress, billing against completion, receivables from public bodies, equipment utilisation and compliance due dates on one screen.
Hill-station tourism (Munnar, Thekkady)
Operator dashboards showing enquiries, conversions, revenue by itinerary and agent, vehicle and guide utilisation, and forward bookings for coming weeks, so that staffing and offers are planned ahead.
Yes, provided your data can be exported or reached. We work with Tally, property management systems, spreadsheets and other databases. The effort depends on how clean and consistent those sources are. If several systems disagree with each other, part of the work is deciding which one is right.
They can. The owner may see everything, a division manager only his division, and a property manager only her resort. Access follows roles. We also build a small number of focused dashboards instead of one crowded screen, because a chart nobody reads helps nobody.
External data can be added where a dependable source exists, such as published auction averages or a rain gauge reading you already record. We are careful with this. Your own operating data is the core, and outside figures are added only when they genuinely assist a decision.
After a first conversation about the decisions you make, the figures you need and where they live, we agree the scope and send you a written quotation. The price, the deliverables and the timeline are fixed against that scope before any work starts, so nothing grows without your sign-off.
You speak to someone who does this work, not a call centre. They ask about the figures you check every week and where they come from. If it looks like a fit, we agree the scope and put it in writing, with the timeline, before any work starts. If it does not, we tell you.
Vandanmedu cardamom auction centremarket
high-range cardamom trading hub near Kumily, described by Kerala Tourism as the largest cardamom auction centre
The largest cardamom auction hub publishes the prices against which a trader's stock is worth valuing daily, the core of a stock-position dashboard.
Source: keralatourism.orgKattappana Municipalitylocal body
Many estate and trading owners live in the second town and run scattered divisions and godowns from it, which is why dashboards here are built for a phone.
Devikulam Block Panchayatlocal body
The block that covers Munnar's estate and tourism belt, where a single owner often needs crop and occupancy figures side by side.
Places and organisations are named for local context only. Acube Innovations is not affiliated with or endorsed by them.
Get a clear plan, an honest timeline, and a fixed scope. Talk to a real expert today — whether or not you work with us.
or write to info@acube.co
Kochi (Kadavanthra & Infopark) · Thiruvananthapuram · across India & overseas · In business since 2011