
Loading…
Loading…
Also serving Bangalore and Bengaluru
Bengaluru companies collect data in a dozen SaaS tools and still argue over last month's revenue; business intelligence dashboards settle the number and show what moved it.
Official ERPNext Partner · 100+ ERP projects · Since 2011
Or call +91 62358 66111
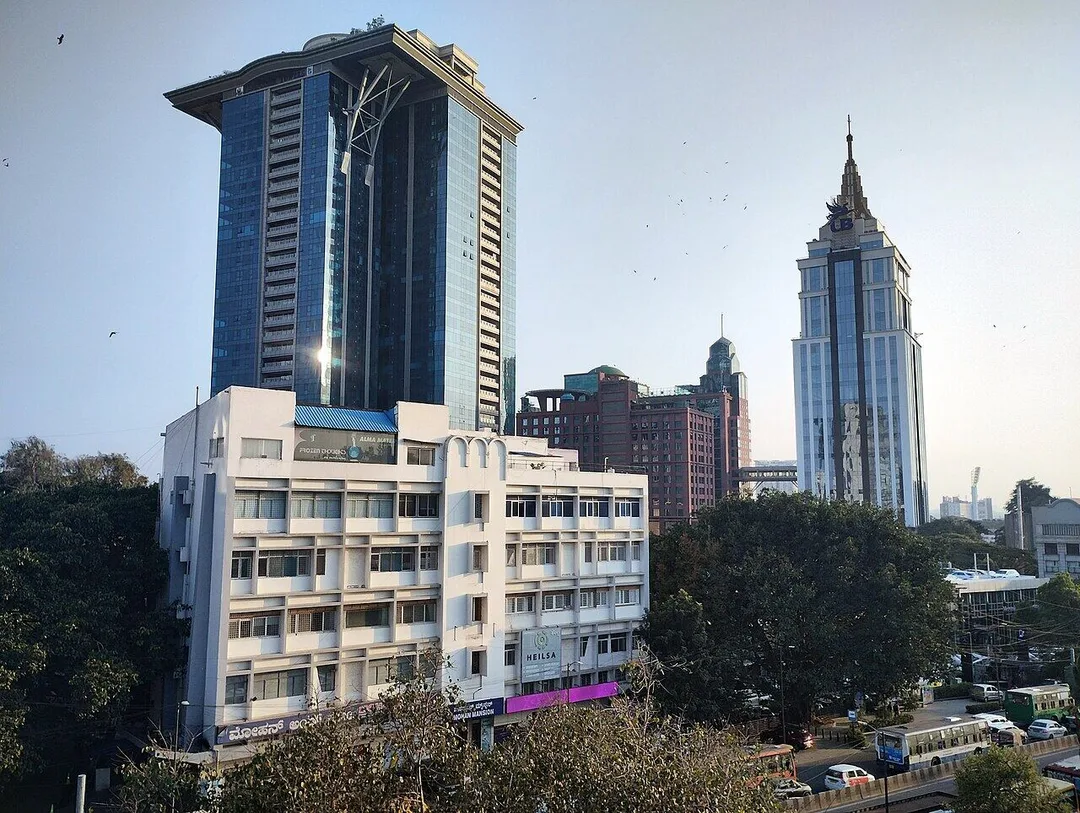
Photo: Gpkp · CC BY-SA 4.0, cropped · via Wikimedia Commons
Trusted by 200+ organisations across India & overseas — including






























Machine tools and engineering
Order book by customer and machine type, shop-floor output against plan, job-wise margin, rework and supplier delivery performance for builders who take their biggest orders at IMTEX and deliver them over the following year.
Readymade garments
Order-to-ship dashboards by buyer and style, line efficiency, piece-rate cost, fabric consumption against standard and on-time shipment for exporters whose season peaks before Dasara and Deepavali and whose buyers audit every delay.
Startups and SaaS
Recurring revenue, churn, collections, burn and runway drawn from billing and accounts in a board-ready view a founder can share with investors, with cohort and customer-wise views that show where revenue really concentrates.
Data is not scarce in Bengaluru. A typical company here has a billing tool, a CRM, a payroll system, ad platforms, a support desk and several spreadsheets, each reporting its own version of events. A machine-tool builder in Peenya, a garment exporter and a SaaS founder on the Outer Ring Road share the same complaint: the Monday review is a debate about whose figure is right.
Acube builds business intelligence and dashboards on ERPNext and on data drawn from your other systems: management dashboards for sales, cash, stock and people, drill-down from summary to voucher, scheduled email reports, alerts when a measure crosses a limit, and consolidated views across companies and branches. Definitions are agreed once, so revenue means the same thing in every chart.

Case studies

Kerala State Road Transport Corporation (KSRTC)
KSRTC — ERPNext Courier System Delivered ₹1 Crore in Profit

Queue Off
Queue Off — Digital Payments That Work on a Feature Phone, With No Internet

Muthoot Securities Limited
Muthoot Securities — MScan, the Flutter App That Cut Document Search Time by 70%
Sales, finance and operations each report revenue differently: booked, invoiced, collected. We define each measure with its owner, build it once from source transactions and label it plainly, which ends most of the argument before the meeting starts.
A report prepared by the tenth is history. Dashboards fed by live transactions show the current position, and alerts flag a falling margin or a rising overdue while it can still be corrected. Small problems stay small.
Skilled people spend days exporting, cleaning and pasting. Automated data pulls and saved reports return that time, so the analyst can ask why a number moved instead of assembling it, and managers get answers the same day.
An example
A readymade-garment exporter with two factories in the city holds its Monday review at nine. The managing director opens one dashboard, not six spreadsheets. Shipments due this week sit at the top, coloured by risk; two styles for a European buyer are behind because fabric arrived late, and the drill-down shows the supplier and the date. Line efficiency by factory is beside it, and the second unit's evening shift is the weak spot again. Receivables ageing shows one buyer slipping past terms, so the finance head sends the reminder before the meeting ends. The production head asks about piece-rate cost against the quote on a new style, and the answer is already on the screen. The review finishes in forty minutes, with three actions and no argument about numbers.
Dashboard projects begin with questions rather than charts. In a workshop, held in Bengaluru or on video, we ask each manager what they need to decide every week and what they look at today. Data connections and models are built from Kochi, and first drafts are shared early so definitions can be argued over before they are fixed. Refinement continues after launch.
Discovery. The decisions you make, the figures behind them and where those figures live.
Blueprint and fixed scope. A clear plan, the deliverables and the timeline, agreed in writing before configuration starts.
Configuration. Dashboards and reports built from your ERP and other sources, with the right access.
Data migration. Your data sources connected and the figures checked against your own reports.
Training, go-live and support. Your team tests on real data, we stand beside you at launch, then support continues under a plan.
The scope and timeline are agreed in writing before work starts.
Yes, provided your systems allow access through an API, a database connection or scheduled exports. We assess each source first. Where ERPNext is the core, dashboards are quicker because sales, stock, accounts and HR already share one database.
Yes. Access follows roles, so a unit head sees one unit and the finance head sees everything. The permission rules that protect transactions in ERPNext apply to its reports and dashboards, and sensitive figures such as salaries can be restricted further.
Each tool charts its own data and cannot set sales against collections against stock, because those live elsewhere. A Bangalore business running many tools needs one layer that joins them under shared definitions, so no tool's numbers contradict another's.
After a first conversation about the decisions you make, the figures you need and where they live, we agree the scope and send you a written quotation. The price, the deliverables and the timeline are fixed against that scope before any work starts, so nothing grows without your sign-off.
You speak to someone who does this work, not a call centre. They ask about the figures you check every week and where they come from. If it looks like a fit, we agree the scope and put it in writing, with the timeline, before any work starts. If it does not, we tell you.
Machine tool cluster, Bengalurucluster
UNIDO-backed national programme for the machine-tool industry centred on Bengaluru (2001-02 onward); the city hosts IMTEX, South Asia's largest machine-tool fair, per the district profile.
The UNIDO-backed cluster and the IMTEX fair mean order books fill in bursts; dashboards that show load, delivery and margin by machine type keep that order book honest through the year.
Source: dcmsme.gov.inReadymade garments cluster, Bengalurucluster
One of the 411 DC-MSME clusters (soft intervention from 2004-05); readymade garments are the district's largest MSE employer after engineering in the 2016-17 profile and a listed export item.
The district's biggest MSE employer after engineering ships to a seasonal calendar; buyer-wise on-time delivery, line efficiency and fabric variance are the measures its owners need each morning.
Source: dcmsme.gov.inPlaces and organisations are named for local context only. Acube Innovations is not affiliated with or endorsed by them.
Everything about Business Intelligence All solutions in Bengaluru Urban
More solutions in Bengaluru Urban
Get a clear plan, an honest timeline, and a fixed scope. Talk to a real expert today — whether or not you work with us.
or write to info@acube.co
Kochi (Kadavanthra & Infopark) · Thiruvananthapuram · across India & overseas · In business since 2011