
Loading…
Loading…
Also serving Bangalore and Bengaluru
Bengaluru changed shape faster than anyone could map it; WebGIS puts land, assets, wards and routes on one live map that planners, builders and utility teams can query.
Or call +91 62358 66111
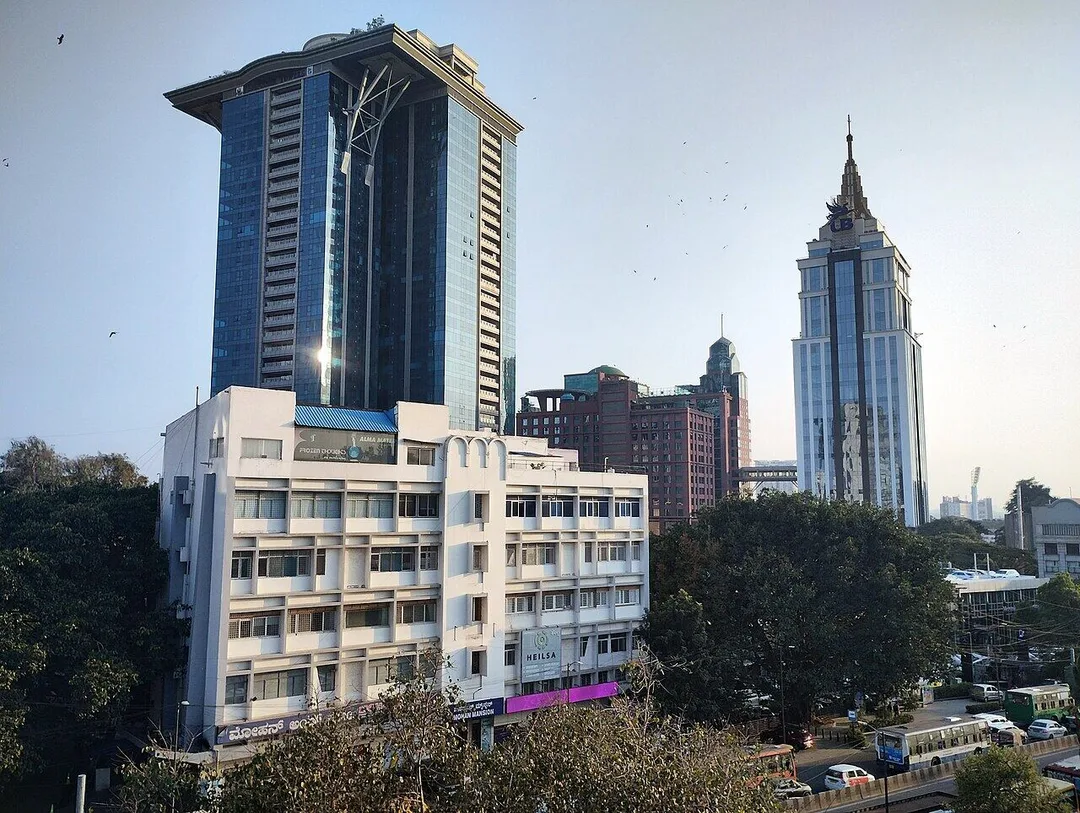
Photo: Gpkp · CC BY-SA 4.0, cropped · via Wikimedia Commons
Trusted by 200+ organisations across India & overseas — including






























Bengaluru Urban covers 2,196 sq km across five taluks, twenty hoblis and 588 villages, per the district administration, and the city government itself was redrawn in 2025: the Greater Bengaluru Authority took over from the old corporation and five city corporations began work that September. Villages became townships within a decade. Storm drains, lake boundaries and road widths are daily news. Decisions about where to build, what to repair and how to route are spatial, yet they are usually made from a list of addresses and a static picture.
WebGIS at Acube means browser-based mapping built on open GIS: interactive maps with layers, filters and search, asset and infrastructure management on a map, land and planning tools, GPS-tagged field capture and spatial analysis such as proximity, routing and heat maps. We use PostGIS, QGIS, Leaflet and OpenLayers, so there is no commercial GIS licence to carry.

Case studies

Indus Motor Company Private Limited
Indus Motor — ERPNext Cut Stock-Outs 40% Across Showrooms

Della Fashions
Della Fashions — ERPNext POS Made Checkout 60% Faster Across Every Outlet

Kochi Metro Rail Limited (KMRL)
Kochi Metro (KMRL) — ERPNext Property & Lease Management, Zero Paper
Developers and landowners track survey numbers, conversions, approvals and litigation in folders. Parcels drawn on a map with documents and status attached let a land team see what is clear, what is pending and what adjoins what, which shortens diligence on the next site.
Pipelines, street lights, cables, borewells and towers are maintained by people who remember where they are. Mapping each asset with its condition and service history turns that memory into a record the organisation owns, so repairs are planned by location and age.
Hubs and dark stores are placed where rent is low and hope is high. Order heat maps, drive-time catchments and service-area analysis show where demand actually sits across Bengaluru's uneven traffic, so an expansion is tested on the map before a lease is signed.
An example
A contractor maintaining drains for a stretch of the western wards starts the morning with the map open. Overnight complaints have landed as pins, and three of them cluster along one stretch of storm drain. The supervisor assigns that stretch to a crew, and their phones carry the drain alignment, the last desilting date and photographs from the previous visit. At the site the crew tags what they find, takes a photo and closes the job on the phone; a fourth pin turns out to be a private line and is marked so. By afternoon the ward dashboard shows what is done, what is open and which stretch has now been cleared twice this season, which is the argument for rebuilding it.
A WebGIS project starts with your data: survey drawings, spreadsheets, GPS logs, imagery. We assess that remotely, then hold a requirements workshop with the planners or engineers who will use the map. Development and data processing happen in Kochi, with a staging site you can open on any day. Field-app training is done on the ground with the survey teams.
Discovery and data audit. Your spatial data and the decisions the map must support.
Data model. Your data modelled in a spatial database, clean and ready to scale.
Map and application design. Layers, filters, search, dashboards and field capture around your users.
Integration. The map connected to your ERP, asset registers and GPS feeds.
Deploy, train and support. Launched on a stack you control, your team trained, support kept on.
The scope and timeline are agreed in writing before work starts.
Real estate
Land bank maps with parcel boundaries, ownership and approval status, surrounding infrastructure layers and project dashboards for developers buying on the expanding edge. Management sees the whole land position before a purchase meeting.
Civic services and utilities
Asset mapping, complaint locations, field inspection apps and ward-wise dashboards for local bodies, water and power utilities and the contractors who maintain infrastructure for them. Supervisors see open and closed work by ward each morning.
Logistics and quick commerce
Store and dark-store siting, delivery catchments by drive time and order-density maps for operators deciding where to open next, comparing candidate sites by reachable households and competition rather than by rent alone.
No. We build on open components such as PostGIS, QGIS, standard web map services, Leaflet and OpenLayers. You own the application and the data, and there is no per-seat GIS licence. Data already held in commercial GIS formats can be imported.
Yes. Spatial records can link to ERPNext assets, projects or customers, and live vehicle positions can be drawn from a tracking provider's API, so the map becomes another view of data you already hold rather than a separate system to feed.
No, though public bodies are heavy users. The need also sits with developers holding land banks, utility contractors, logistics planners and facility teams running large campuses. If your main question begins with where, it is usually a GIS question.
After a first conversation about your spatial data, the users and the decisions the map has to support, we agree the scope and send you a written quotation. The price, the deliverables and the timeline are fixed against that scope before any work starts, so nothing grows without your sign-off.
You speak to someone who does this work, not a call centre. They ask about the data you hold, who needs to see it on a map and what they decide from it. If it looks like a fit, we agree the scope and put it in writing, with the timeline, before any work starts. If it does not, we tell you.
Greater Bengaluru Authority (succeeded BBMP; fully operational 2 September 2025)local body
When a city government is restructured, every ward boundary, asset register and complaint history has to be re-cut to the new geography, which is map work before it is paperwork.
Bengaluru North City Corporationlocal body
The northern corporation covers fast-growing layouts where new roads, drains and street lighting are added faster than any register is updated, so the map is the only current record.
Bengaluru West City Corporationlocal body
The western wards mix old neighbourhoods with industrial land, and utility contractors working there need asset and complaint layers that cross both kinds of area.
Peenya Industrial Area (KIADB, Stages I–IV)park
Largest KIADB area in the district at about 1,485 acres on Tumkur Road (NH-4), west Bengaluru; set up in the late 1970s; engineering and electrical goods, machine tools, die-casting, transformers and motors; also has KSSIDC flatted-factory complexes in each of its three estate stages and a BIS testing centre.
An estate of this size has its own internal networks of roads, drains, water lines and power, and an association or facility team maintaining them benefits from mapping them once, properly.
Source: dcmsme.gov.inPlaces and organisations are named for local context only. Acube Innovations is not affiliated with or endorsed by them.
Everything about WebGIS Development All services in Bengaluru Urban
More services in Bengaluru Urban
Get a clear plan, an honest timeline, and a fixed scope. Talk to a real expert today — whether or not you work with us.
or write to info@acube.co
Kochi (Kadavanthra & Infopark) · Thiruvananthapuram · across India & overseas · In business since 2011