
Loading…
Loading…
Also serving Trivandrum
Managements in Thiruvananthapuram are served reports weeks old, assembled by hand. Business intelligence dashboards show utilisation, occupancy and receivables as they stand today.
Official ERPNext Partner · 100+ ERP projects · Since 2011
Or call +91 62358 66111
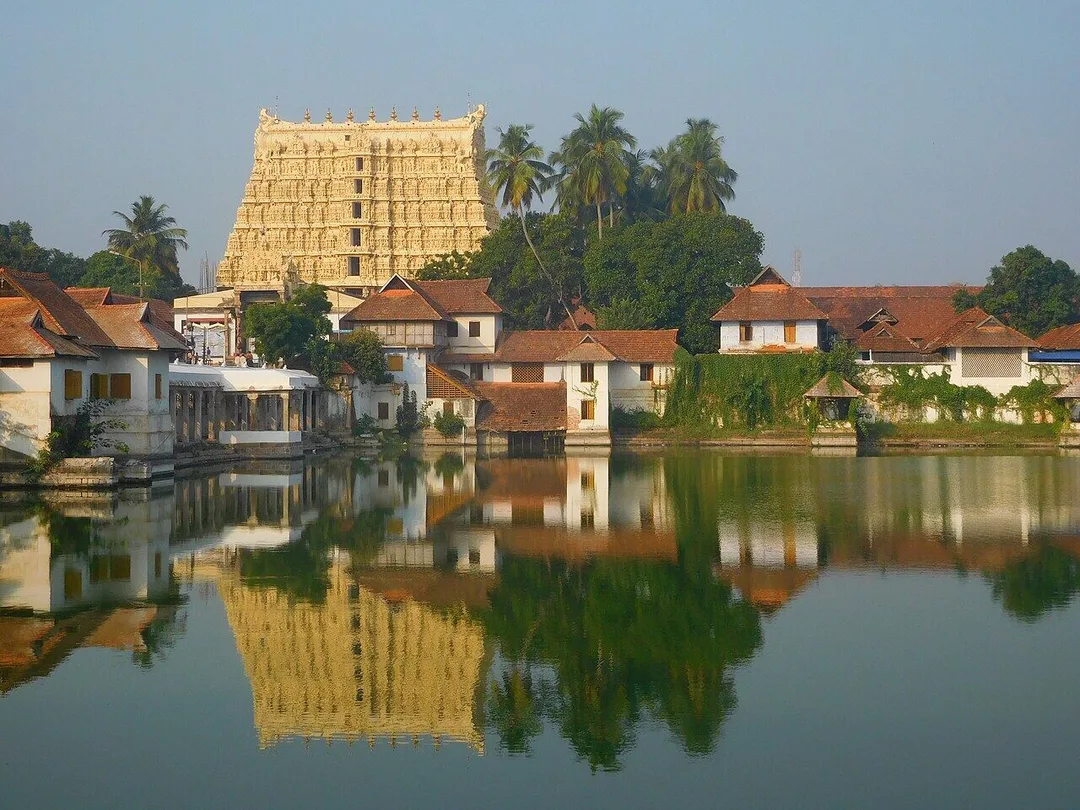
Photo: Shishirdasika · CC BY-SA 4.0, cropped · via Wikimedia Commons
Trusted by 200+ organisations across India & overseas — including





























IT/ITeS and software
Technopark companies track utilisation, revenue per employee, project margins, receivable ageing by client and hiring pipeline, with drill-down to the timesheet or invoice behind each figure. Delivery heads see their own accounts and the leadership sees the whole company.
Government and public administration
PSUs and boards monitor budget against actuals, scheme or project progress, procurement cycle times and pending approvals, in a form that can be shown to a review committee without re-preparation. Data stays on servers the organisation controls.
Tourism and hospitality
Hotel groups across the city and Kovalam watch occupancy, average room revenue, outlet sales, food cost and booking source by property, and compare the current season with the last.
The organisations that define this district, software firms in Technopark, PSUs, hotel groups on the coast and large institutions, are run by people who like numbers. The trouble is how the numbers reach them. An analyst exports from four systems, works in Excel for days and circulates a presentation that is stale on arrival. Questions raised in the review meeting take another week to answer. Decisions get made on instinct while the data catches up.
We build dashboards and reports using Frappe Insights on ERPNext data, and combine other databases where needed. Managers see live KPIs, drill from a total down to the transactions behind it, and receive scheduled reports by email. For a Trivandrum leadership team, the practical change is that the review meeting discusses what to do, not whose figures are right.

Case studies

Cochin Technical College
Cochin Technical College — Custom ERP Cut Admission Processing Time by Over 60%

Connect N Cabs Tours & Travels Pvt. Ltd.
Connect N Cabs — A Custom Travel ERP That Lifted Fleet Utilisation 35%

Muthoot Securities Limited
Muthoot Securities — MScan, the Flutter App That Cut Document Search Time by 70%
An IT services firm learns how many engineers were unbilled only after payroll closes. Utilisation dashboards from timesheets show billable and bench hours by team each week, while there is still time to redeploy people.
Finance, operations and sales each bring a different revenue figure to the meeting. One defined metric, calculated from the ledger and visible to all, ends the debate and exposes the process gaps that caused the difference.
When the analyst who builds the monthly pack is on leave, management goes blind. Automated, scheduled reports remove that dependence and free the analyst for analysis instead of copying and pasting.
An example
Friday afternoon at a services company in Technopark, and the delivery heads gather for the weekly review. Nobody has brought a spreadsheet. The utilisation board is on the wall screen: billable hours by team for the week, bench by skill, and the two projects whose margin has slipped since Monday. One head clicks into her project and sees the timesheet entries that caused it, a senior engineer logging hours to a fixed-price job that was already over budget. She reassigns him before the meeting ends. The finance controller pulls up receivables by client and points at an overseas customer whose invoices have aged past sixty days. The managing director asks one question about hiring, and the answer is already on the next tab. The meeting closes early.
We start by asking which decisions you make regularly and which numbers they need, then trace each number to its source. The first dashboards are usually ready early, because they expose data problems that must be fixed before anything grander. Workshops with your management are held in Thiruvananthapuram, and your team is trained to build its own charts.
Discovery. The decisions you make, the figures behind them and where those figures live.
Blueprint and fixed scope. A clear plan, the deliverables and the timeline, agreed in writing before configuration starts.
Configuration. Dashboards and reports built from your ERP and other sources, with the right access.
Data migration. Your data sources connected and the figures checked against your own reports.
Training, go-live and support. Your team tests on real data, we stand beside you at launch, then support continues under a plan.
The scope and timeline are agreed in writing before work starts.
Yes, within limits. Frappe Insights connects to common external databases, so figures from other applications can sit beside ERPNext data. Data held only in spreadsheets is harder, and we usually suggest moving that process into a system first.
Yes. Dashboards respect roles, so a property manager sees one hotel, a delivery head sees one business unit, and the directors see everything. The same applies to scheduled emails, which go only to the people entitled to that information.
Standard dashboards describe what has happened. Forecasting demand, cash or attrition is custom work that our AI team builds on top of clean historical data. We will tell you honestly whether your data is ready for that step.
After a first conversation about the decisions you make, the figures you need and where they live, we agree the scope and send you a written quotation. The price, the deliverables and the timeline are fixed against that scope before any work starts, so nothing grows without your sign-off.
You speak to someone who does this work, not a call centre. They ask about the figures you check every week and where they come from. If it looks like a fit, we agree the scope and put it in writing, with the timeline, before any work starts. If it does not, we tell you.
Technopark, Kazhakkoottampark
State-owned IT campus founded July 1990; the park's own site lists 540 companies, 84,000+ employees and about 768 acres as of 2026, plus a Technocity phase at Pallippuram
Services firms in the park live on utilisation and project margin; a dashboard that drills from a team total to the individual timesheet is the report their delivery heads actually need.
Source: technopark.inVizhinjam International Seaporttransport
deepwater container transshipment port developed by the state under a landlord PPP model; commercial operations from 2024, direct EXIM cargo from August 2026
Logistics operators building volumes at the seaport need cost per container, detention exposure and turnaround by customer, figures that only exist when trip and job data are joined on one screen.
Source: vizhinjamport.inAttingal Municipalitylocal body
Trading and hospitality businesses spread from the city to Attingal and Varkala want branch-wise sales and occupancy compared side by side, which a single database with role-based dashboards provides.
Places and organisations are named for local context only. Acube Innovations is not affiliated with or endorsed by them.
Everything about Business Intelligence All solutions in Thiruvananthapuram
More solutions in Thiruvananthapuram
Get a clear plan, an honest timeline, and a fixed scope. Talk to a real expert today — whether or not you work with us.
or write to info@acube.co
Kochi (Kadavanthra & Infopark) · Thiruvananthapuram · across India & overseas · In business since 2011