
Loading…
Loading…
Also serving Secunderabad
Hyderabad grows outward every year; planners, developers and delivery businesses need their sites, assets and customers on a live map rather than in a spreadsheet of pin codes.
Or call +91 62358 66111
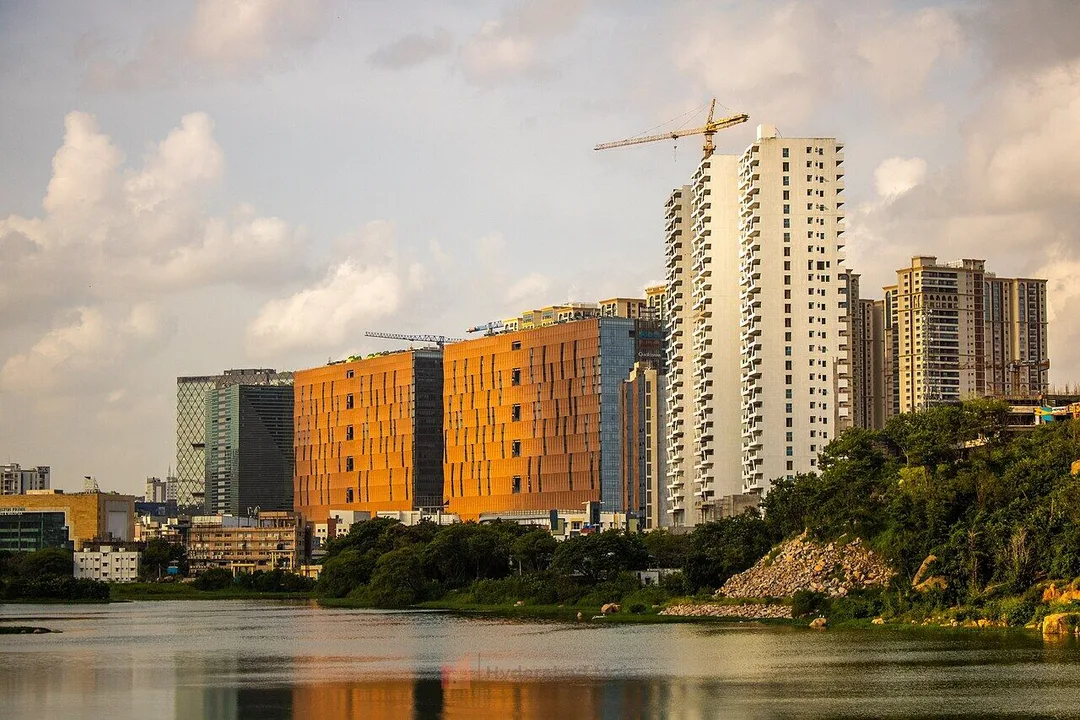
Photo: Sharath G. · Pexels License · via Pexels
Trusted by 200+ organisations across India & overseas — including

























Few Indian cities have changed shape as fast as Hyderabad. New towers rise beyond Gachibowli, the metro has redrawn commuting, lakes and drains are a matter of public record and public argument, and delivery riders cover every lane from Secunderabad to the Old City. Nearly every decision about the city has a location in it, and the Outer Ring Road keeps pushing the edge outward.
WebGIS puts that location data to work. We build browser-based map applications on open-source GIS: layers of parcels, assets, customers or routes, with search, filters, drill-down and spatial analysis such as proximity and heat maps. Field teams capture GPS-tagged data on a phone and it appears on the central map. You own the code and pay no per-user mapping licence.

Case studies

DSV Global Transport and Logistics
DSV — ERPNext Asset Tagging Cut Untraceable Assets 21%

Indus Motor Company Private Limited
Indus Motor — ERPNext Cut Stock-Outs 40% Across Showrooms

MultiWealth Capital
MultiWealth Capital — ERPNext Cut Loan Processing Time by 60%
A developer's land team holds survey sketches, title notes and approvals in separate folders, and nobody can see the whole holding at once. A parcel map with documents attached to each plot makes the land bank searchable by location, status and size.
Urban bodies and utilities manage streetlights, pipelines, valves and drains from old drawings. When a field engineer can see and update each asset on a map from a phone, maintenance history and complaints finally sit in one place.
Food, grocery and pharmacy delivery in Hyderabad is planned around flyovers and one-way stretches that a pin-code list cannot capture. Drawn service zones and order heat maps show where a new dark store would really help.
An example
A developer with an office off the Gachibowli main road owns land in a dozen places along the Outer Ring Road, and the land team keeps each holding in a folder: a survey sketch, a title note, an approval letter, a photograph. On the first day we ask for the folders and the coordinates from the surveyor's files. Within the month the managing director opens a browser and sees every parcel as a shape on a map, coloured by approval status, with the documents attached to each one. He clicks a plot near Shamshabad and reads the title note. He filters to holdings within a short drive of a metro station and finds two he had forgotten. The land team now adds a new survey from a phone on site, and the map is the record.
A WebGIS build is delivered remotely from Kochi in stages you can see: data audit first, then a base map with your layers, then the tools on top. Your shapefiles, survey data and spreadsheets are shared securely and cleaned as part of the work. Where field data collection in Hyderabad is involved, we train your surveyors on the mobile app, on site if the team is large.
Discovery and data audit. Your spatial data and the decisions the map must support.
Data model. Your data modelled in a spatial database, clean and ready to scale.
Map and application design. Layers, filters, search, dashboards and field capture around your users.
Integration. The map connected to your ERP, asset registers and GPS feeds.
Deploy, train and support. Launched on a stack you control, your team trained, support kept on.
The scope and timeline are agreed in writing before work starts.
Apartment and plotted developers
Land bank and project maps with plot boundaries, approval status, nearby infrastructure and competitor projects as layers, plus site progress photographs pinned to location for management review.
Municipal and cantonment bodies
Ward-wise asset registers, complaint pins, drain and road inventories, and works tracking on a map that the corporation's or the Cantonment's field staff update from a phone, with public layers where wanted.
Retail and delivery businesses
Store catchment and customer density maps, delivery zone design, route planning for last-mile fleets, and territory maps for sales teams, all drawing on order and customer data you already hold.
No. We build on open, standards-based tools such as PostGIS, OpenLayers, Leaflet and QGIS, which carry no per-user licence fee. If your organisation already holds commercial GIS data or services, the application can consume those as well.
Generally, yes. CAD drawings can be georeferenced, and spreadsheets with addresses or coordinates can be plotted. Expect some cleaning, since old drawings rarely line up perfectly. The data audit at the start tells you what is ready and what needs correction.
Yes. We have delivered software for public-sector organisations and are used to tender-based procurement, documentation requirements and security reviews. Hosting can be on government-approved infrastructure, and full source code is handed over.
After a first conversation about your spatial data, the users and the decisions the map has to support, we agree the scope and send you a written quotation. The price, the deliverables and the timeline are fixed against that scope before any work starts, so nothing grows without your sign-off.
You speak to someone who does this work, not a call centre. They ask about the data you hold, who needs to see it on a map and what they decide from it. If it looks like a fit, we agree the scope and put it in writing, with the timeline, before any work starts. If it does not, we tell you.
Greater Hyderabad Municipal Corporation (GHMC)local body
The single corporation covering the city, whose roads, drains, streetlights and property records are location data by nature; a ward-level asset map updated from the field is a natural WebGIS build.
Hyderabad Metrotransport
three lines (Miyapur-LB Nagar, Nagole-Raidurg, JBS-Falaknuma), 57 stations, about 67 km, opened 2017
Three lines and fifty-seven stations, opened in 2017, that redraw catchments for retail, housing and delivery; distance to a station is a layer every site-selection map in the city now needs.
Source: en.wikipedia.orgKothapet (Gaddiannaram) fruit marketmarket
one of the largest fruit markets in Telangana, on the LB Nagar side; a shift to Koheda has been proposed to ease congestion
One of the largest fruit markets in Telangana, with a shift to Koheda proposed to ease congestion; a market-move decision like that is precisely what a traffic and catchment map informs.
Source: en.wikipedia.orgSecunderabad Cantonment Boardlocal body
A separate local body with eight civilian wards inside the city; its roads, water lines and properties need their own asset layers, kept apart from the corporation's but viewable on one map.
Places and organisations are named for local context only. Acube Innovations is not affiliated with or endorsed by them.
Everything about WebGIS Development All services in Hyderabad
More services in Hyderabad
Get a clear plan, an honest timeline, and a fixed scope. Talk to a real expert today — whether or not you work with us.
or write to info@acube.co
Kochi (Kadavanthra & Infopark) · Thiruvananthapuram · across India & overseas · In business since 2011