
Loading…
Loading…
Also serving Madras
Chennai's drains, lakes, container yards and building plots only make sense on a map; WebGIS puts that map in a browser, tied to live operational data.
Or call +91 62358 66111
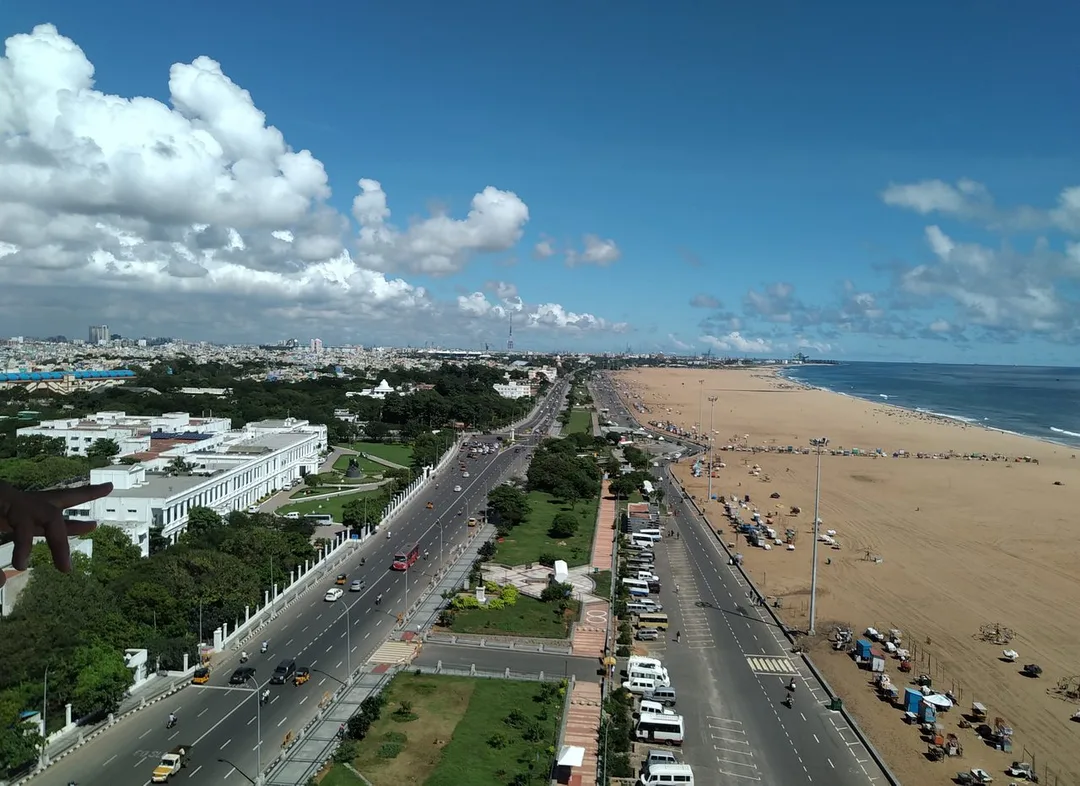
Photo: SlowPhoton · CC BY-SA 4.0, cropped · via Wikimedia Commons
Trusted by 200+ organisations across India & overseas — including






















Few Indian cities are as shaped by geography as Chennai. Three rivers, a long coast, hundreds of tanks and lakes, low-lying suburbs that flood in a heavy North-East monsoon, two ports to the north and an IT corridor running south. Where to build, where to route trucks and where water will go are spatial questions, and most organisations still answer them from spreadsheets.
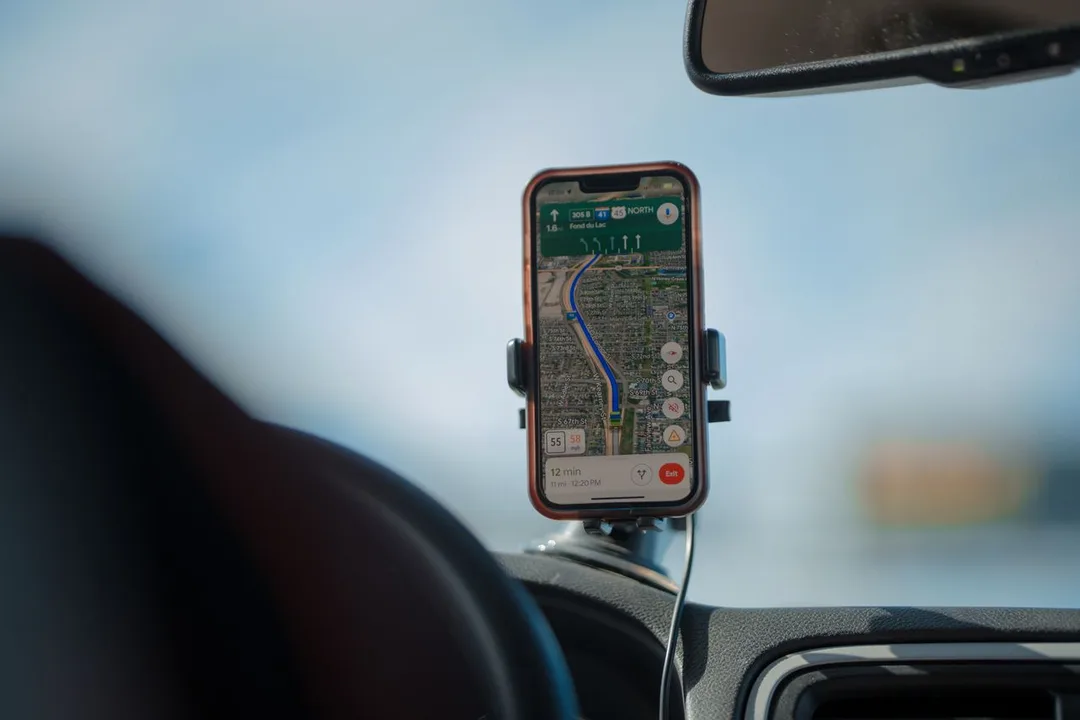
WebGIS development brings those answers into an interactive map anyone with permission can open in a browser. We build on open GIS technology, including PostGIS, Leaflet, OpenLayers and QGIS, so there are no per-seat licence fees and you own the code and the data. Builds combine base maps, your own layers, field data captured on mobile with GPS, and analysis such as proximity, routing and heat maps.
Case studies

Kerala State Road Transport Corporation (KSRTC)
KSRTC — ERPNext Courier System Delivered ₹1 Crore in Profit

Dumas Bakes N Meals Private Limited
Dumas Bakes N Meals — ERPNext Lifted On-Time Deliveries by Over 40%

EVM Wheels (part of the EVM Group)
EVM Wheels — 70% of Self-Drive Rentals Now Book Themselves Through the App
Civic bodies and utilities in the Madras metropolitan area hold registers of drains, pipelines, streetlights and valves as lists, with locations described in words. Mapping each asset, with its condition and last inspection, lets an engineer see what lies in a flooded ward.
Developers assessing plots along OMR, ECR or the outer ring road check survey sketches, approach roads, water bodies and flood history one document at a time. A map overlaying parcels, site photographs and known constraints makes the first screening faster.
Container yards and logistics parks in the Madhavaram and Manali zones change layout constantly. A yard map showing zones, stacks and equipment, updated from gate and handheld data, tells a supervisor where things are.
An example
It is a Tuesday in the monsoon and a contractor maintaining storm-water drains for a northern zone has a ward under water. The site engineer opens the WebGIS map on his phone from the roadside. The drain layer shows every culvert and inlet in the ward with its last inspection date and photograph; the ones flagged as silted in October stand out in red. He sends a crew to the two inlets nearest the worst-hit street and marks them cleared on the map as the work is done, with a photo attached. At the head office at Anna Nagar, the project head watches the same map update and answers the zone office's call with facts instead of guesses.
WebGIS projects begin with your data: shapefiles, drawings, coordinates in spreadsheets, GPS logs. We review these remotely, propose the layers and tools, and build in Kochi with a test site you can open from Chennai. For field-data projects we visit to train surveyors on the mobile capture app and to check accuracy on the ground before the map goes live.
Discovery and data audit. Your spatial data and the decisions the map must support.
Data model. Your data modelled in a spatial database, clean and ready to scale.
Map and application design. Layers, filters, search, dashboards and field capture around your users.
Integration. The map connected to your ERP, asset registers and GPS feeds.
Deploy, train and support. Launched on a stack you control, your team trained, support kept on.
The scope and timeline are agreed in writing before work starts.
Ports & logistics
Yard and warehouse maps, route planning between the ports and inland depots, geofenced tracking of trailers on the congested northern approach roads, and delivery-density analysis for last-mile operators across the city.
Real estate & construction
Land-bank maps with parcel boundaries and documents attached, site-selection screening against roads, water bodies and flood-prone zones, and a shared map for surveyors, legal and management.
Retail & FMCG
Outlet and beat mapping for distributors, territory design that balances salesman workload, catchment analysis before opening a store in a suburb such as Porur or Tambaram, and sales heat maps drawn from ERPNext data.
No. We build on open, standards-based GIS software, so there is no per-user fee and no lock-in. If you already hold a commercial licence, the system can still exchange data with it through standard formats.
Where an agency publishes layers as open data or standard map services, they can be added as overlays. Availability differs by agency and changes over time, so we confirm what is accessible for your area at the start.
Yes. Addresses can be geocoded and then corrected by field staff using a phone. Many useful WebGIS projects start this way, with a list of sites or outlets, and gain accuracy as people use them.
After a first conversation about your spatial data, the users and the decisions the map has to support, we agree the scope and send you a written quotation. The price, the deliverables and the timeline are fixed against that scope before any work starts, so nothing grows without your sign-off.
You speak to someone who does this work, not a call centre. They ask about the data you hold, who needs to see it on a map and what they decide from it. If it looks like a fit, we agree the scope and put it in writing, with the timeline, before any work starts. If it does not, we tell you.
Greater Chennai Corporation (the district's only urban local body; 15 zones, 200 wards)local body
Fifteen zones and two hundred wards of drains, roads, streetlights and water bodies. Contractors and utilities serving them need asset registers that live on a map, not in a spreadsheet.
Madhavaram zonelocal body
The northern zone of truck terminals, freight stations and godowns whose yard layouts change weekly. A yard map fed by gate and handheld data replaces the drive-around.
Manali zonelocal body
An industrial zone of refineries, chemical plants and the roads to Ennore. Pipelines, safety zones and access routes here are spatial records first and lists second.
Chennai Metro (CMRL)transport
two operating lines (Blue and Green), about 54 km and 41 stations; three Phase 2 lines under construction
Two operating lines and three Phase 2 lines under construction. Utility diversions, land parcels and progress along an alignment are what a WebGIS build is made for.
Source: en.wikipedia.orgPlaces and organisations are named for local context only. Acube Innovations is not affiliated with or endorsed by them.
Everything about WebGIS Development All services in Chennai
More services in Chennai
Get a clear plan, an honest timeline, and a fixed scope. Talk to a real expert today — whether or not you work with us.
or write to info@acube.co
Kochi (Kadavanthra & Infopark) · Thiruvananthapuram · across India & overseas · In business since 2011